Automating Traffic Analysis with Machine Learning
Summary
Data science and machine learning present new opportunities for improving public spaces. Leveraging these technologies for smart cities can make our communities more livable, more sustainable, and benefit local economies. They can assist with understanding key questions in city planning and urban design such as how public spaces are used, how many users there are, and who the users are.
In this post, we’ll look at a proof-of-concept system we implemented to answer these questions using machine learning for video analysis. It’s an approach that’s easy to deploy and cost-effective. We’ll focus on street intersections in particular, where design impacts traffic congestion, local busineses, and pedestrian safety. The work here is motivated by our own experiences, the Vision Zero goal (eliminating serious accidents on the roads), and the Smart Cities initiative.
To go straight to the videos, click here.
"The best way to plan for downtown is to see how people use it today; to look for its strengths and to exploit and reinforce them." - Jane Jacobs
Introduction
City planners are tasked with making cities that are functional, liveable, and support economic growth. In addition, they must consider environmental impacts, future growth, and the needs of a diverse set of users. Can we leverage data science and machine learning to support them in those tasks by increasing the information they have to make decisions? We’ve developed a prototype system based on automated video analysis, which can provide key information on how to improve public spaces. In this post we’ll look at traffic intersection in particular, since British Columbia is pursuing the goal of Vision Zero – no fatalities or serious injuries from road accidents.
What are some of Vancouver’s worst intersections? According to ICBC data for 2013-2017, there were 692 road accidents at the Main Street and Terminal intersection, 256 of which resulted in injuries or fatalities. For pedestrians, East Hastings and Main Street was top of the list with 35 accidents. Across town, Burrard Street & Pacific was the most dangerous for cyclists with 34 crashes. These accidents are a tragedy for those involved and their families, and impact us all through increased costs for the city and ICBC. If accidents regularly occur somewhere, then an intervention in the street design could save lives.
Video analysis can support agile interventions at dangerous intersections. It can help identify which behaviours lead to accidents, and how contributing traffic patterns arise. This knowledge can be used by cities to implement appropriate design changes. Afterwards, video can be used to understand the impact of any change. The success of an intervention can be measured without having to wait years to see if the statistics have improved. This means a municipality can iterate quickly if the design intervention didn’t have the desired impact. It also allows for knowlege specific to locations. What cyclists need at Burrard Street and Pacific is not the same intervention that would work at Main Street and East Hastings.
Taking a video of a traffic intersection is cost effective, fast to setup, and easy to process. It doesn’t require permament infrastructure, only access to a suitable viewpoint. This means that cameras can be installed rapidly and for temporarily periods of times. The quality of videos we used could be replicated by the current generation of mobile devices. Video analysis can effectively replace or supplement current methods such as pneumatic tubes, induction loops, and manual counts. Advantages of video analysis include being able to distinguish traffic in different lanes, detect intersection turn patterns, and monitor events such as near-misses. Additionaly, it can uniquely provide reliable pedestrian counts and movement patterns, quantifying information such as walking speed, stickiness, pedestrian density.[1]
Traffic Analysis
Let’s look at applying machine learning to videos of street intersections, and the data we can pull out to support municipalities. We’ve constructed a proof-of-concept system, combining deep learning (neural networks) and object tracking algorithms, that can automatically process videos.
We’ll apply our system to analyze videos of two intersections in the downtown area of Vancouver. The first is Homer Street and West Georgia, and the second is Abbot Street and West Cordova. These locations offer different views of the streets, and different volumes of traffic. From the video of Homer Street at West Georgia, we’ll see that the system scales to handle large amounts of traffic. In the analysis of the West Cordova intersection, we’ll also see how we can automatically spot unexpected pedestrian crossings. After the initial setup of our codebase and system, analyzing further intersections was a simple task.
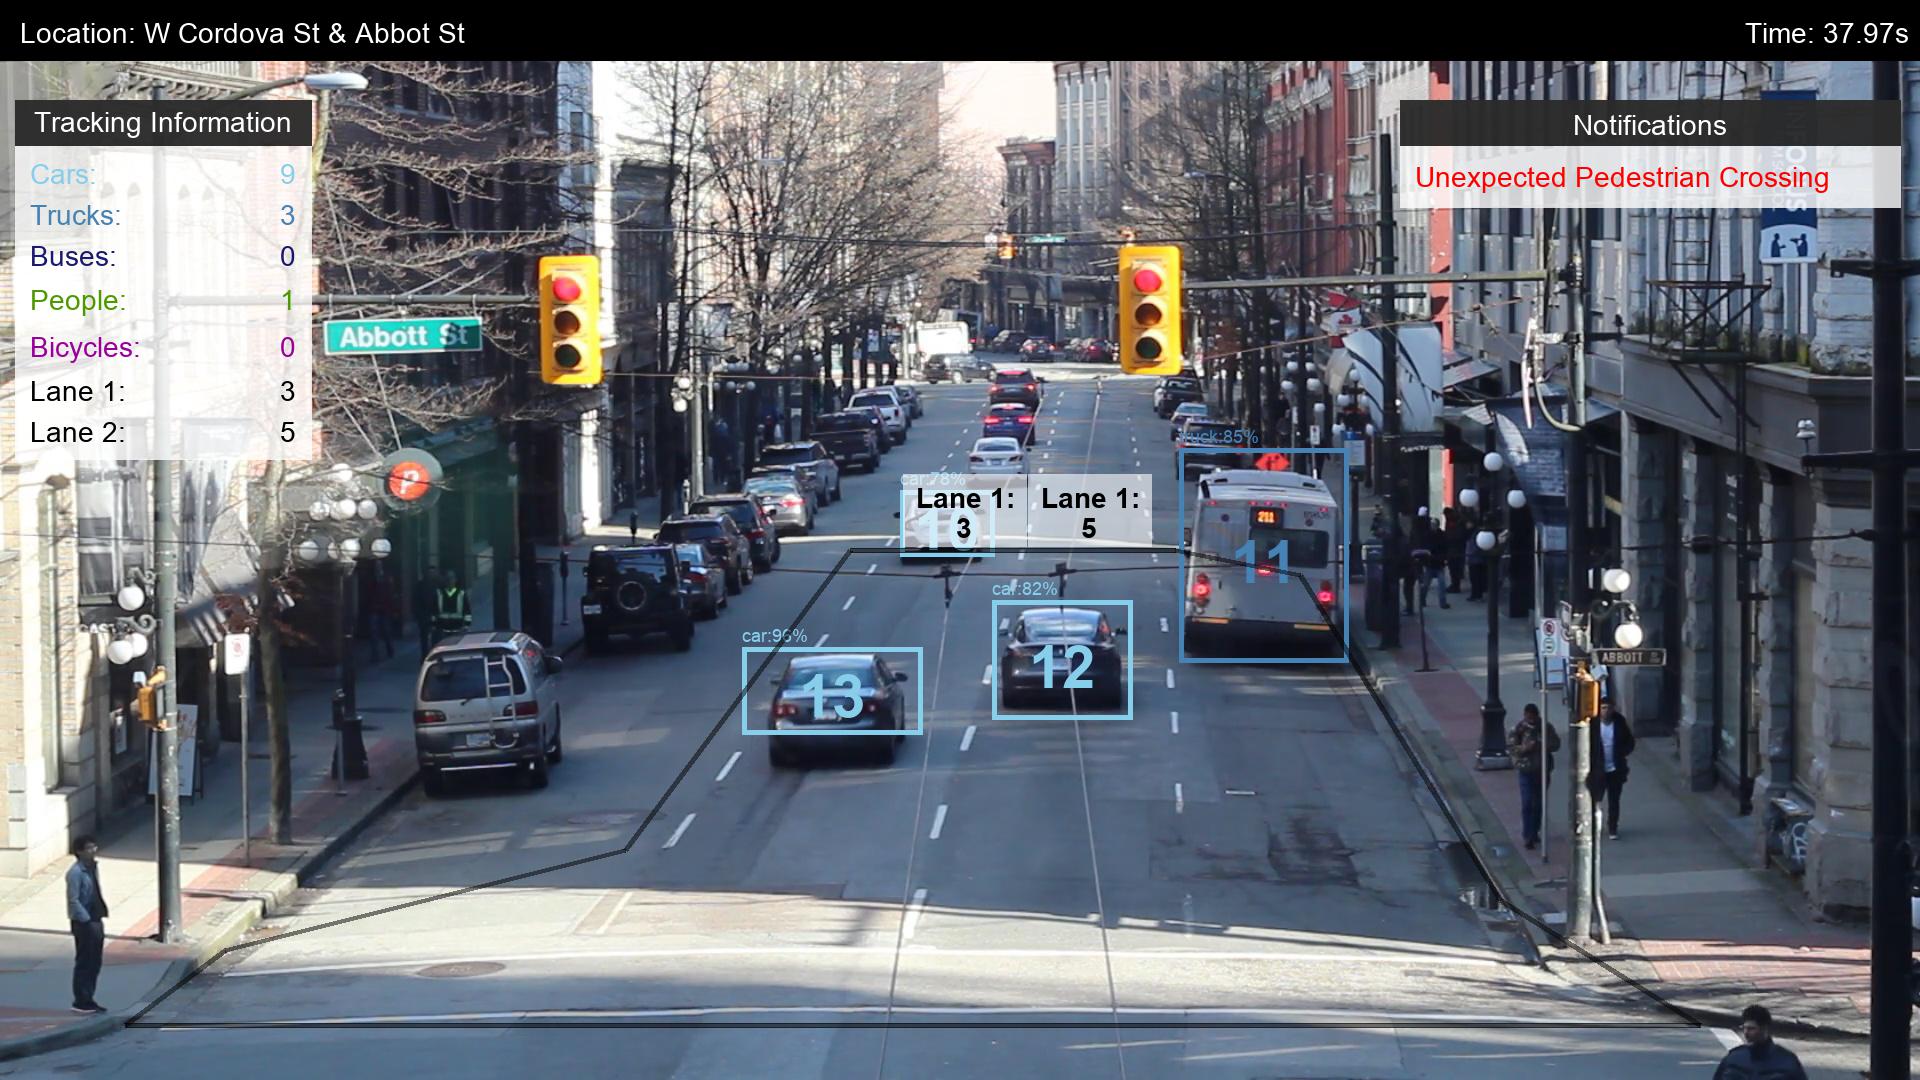
Our dashboard overlays the video with the results of our computer vision algorithms. Objects in the traffic flow that have been identified have a bounding box, and are assigned a unique identifier in the scene. The colour of the bounding box corresponds to the entries in the Traffic Information panel. There we display the counts of the different types of users. In this scene we count the spectrum of traffic: pedestrians, cyclists, cars, trucks, and buses. In the lower left hand corner we have a plan view (top-down) of traffic that we extrapolate from our video data. A header at the top displays the location and time of the video.
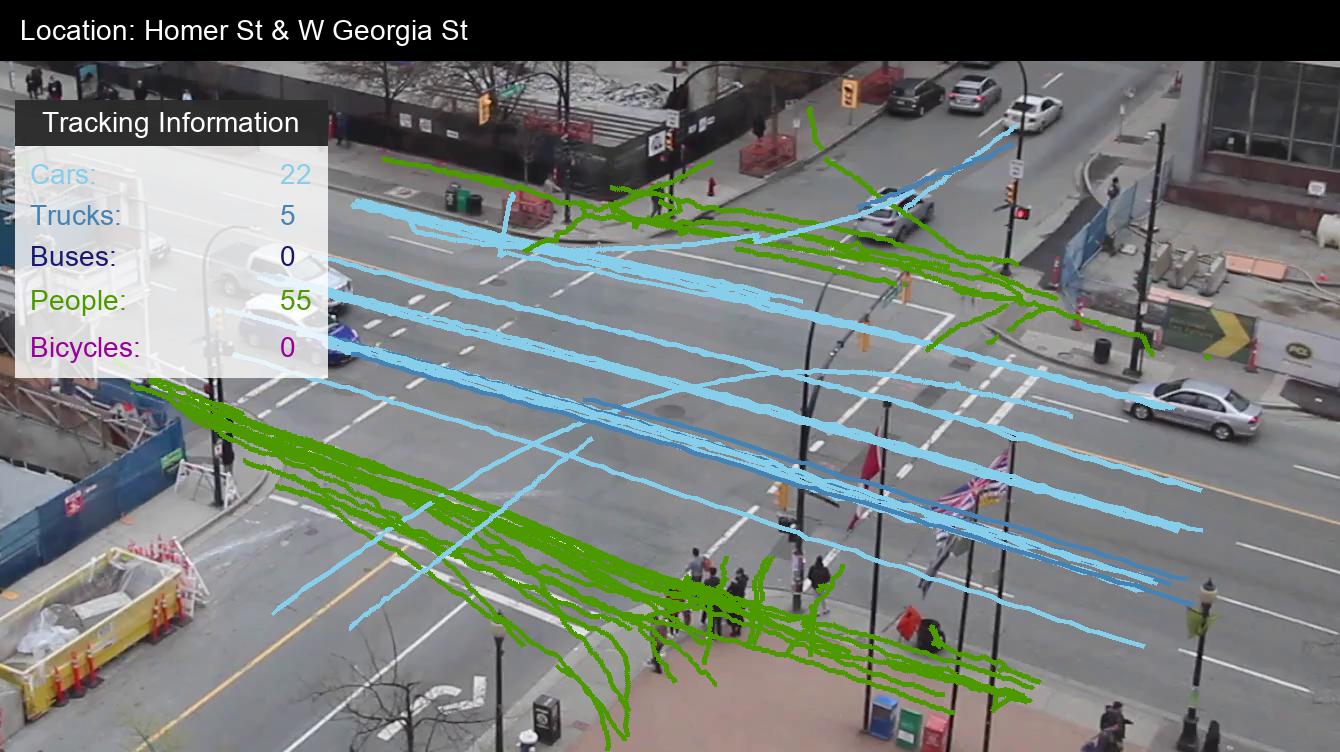
An advantage of using algorithmic counting is that it scales well with the volume of traffic. Our system counts over 50 cars and over 100 pedestrians in the video. Manually counting this amount of traffic, even in a short video clip, would be challenging and time intensive. We not only get a count of how users there are, but the path they took through the intersection. The traces of traffic from a part of the video are shown in the second image. We can compare the amount of vehicles driving through the intersection as opposed to turning. We can also notice a number of pedestrians begin crossing the street outside of the crosswalk lines.
Our system reprojects traffic flow into a top-down view. While we currently take a simple approach to this operation, a more robust system would enable several features. These include measuring the speed of vehicles, and the distances between different users. This would allow us to quantify near-misses, such as when a moving car comes within a certain distance of cyclist or pedestrain. Currently we have data on accidents that occur, but not on close calls that may cause users to take different routes or alter their mode of transport.
Automated analysis allows us to identify and quantify events of interest. We defined two counters in the video of West Cordova at Abbot street to determine how many cars use each lane. This information would be useful if the city wanted to remove street parking, install a dedicated bike line, or look at the impact of introducing bus priority lanes. Further, we can integrate the timing of the traffic lights into our video. We did this to set an alert when pedestrians cross the road unexpectedly. We can investigate whether this is a common occurence and whether pedestrians aren’t given sufficient opportunities to cross at intended times.
Since our sysem is a proof-of-concept, our features can be improved upon, and new ones developed. There are lapses in the identification of traffic – bicycles can be misclassified as people, and the labelling of cars, trucks, and buses is sometimes mixed up. We also see that when there are is a large group of pedestrians, the system has trouble distinguishing people and tracking them as they get obscured in the crowd. More rigorous algorithms can be implemented to handle these situations. Our proof of concept relies on a single camera. We can further extend our system by incorporating cameras at multiple viewpoints, adding an infrared camera, and using dual-lens sytems for depth perception.
Where else can we apply this technology? The city of Vancovuer recently spent 5 million dollars renovating Robson Square. Is the space being used to its full potential? We can use automated video analysis to study how the space is used through the day. This includes quantifying the patterns of people using the space to travel, as a meeting place, and recreationally. A modern update to the time-lapse cameras used by noted urbanist William H. Whyte for studying public spaces in the seventies.[2] Similarily, Granville Island is in the process of significant changes. These will impact pedestrian movement, as well as pedestrian/bicycle/car interactions. Reliable traffic information allows us to maximize both the investment in and the benefits of the space.
Conclusions
Leveraging machine learning, we’ve built a proof-of-concept system that automatically provides traffic information from video data. We’ve applied it to two intersections, showing that it track volumes of traffic that would otherwise be prohibitive to count manually, and that it can capture events like unexpected pedestrian crossings. This information can be used by municipalities to make design improvements at unsafe intersections, and test the effectiveness of interventions, saving lives and money. This simple and efficient system can positively contribute to the Vision Zero goal, eliminating serious accidents on our roads.
[1]: Relevant discussion here: Danish Architect Jan Gehl on Good Cities for Walking
[2]: A classic documentary by Whyte on urban spaces: Social Life of Small Urban Spaces