The Future Hydrology of the Pacific Northwest
Water is a critical resource in the Pacific Northwest. The effects of climate change on hydrological resources will be felt by a wide range of communities. Cities, First Nations, farmers, and the environment will all be affected. Effective management of water resources will become increasingly important to meet the diverse needs of the region.
Climate models provide insight into how hydrological conditions and water resources will change in the future. This includes changes in the availability of water, and the occurence of catastrophic events like floods and droughts. Understanding these changes is essential to prepare and adapt for the future. In this post, we’ll look at the output of a suite of projections to understand the changes in hydrology we can expect over the next hundred years.
The dataset[1][2] we use is an ensemble of modelled streamflows across the Pacific Northwest. Streamflows are predicted at approximately 400 locations, using a variety of hydrological and climate models. The modelled period is between 1950 and 2100, with streamflow output on a daily timestep. Two different greenhouse gas concentration trajectories are modelled: RCP 4.5 and RCP 8.5. These RCP scenarios are from the Intergovernmental Panel on Climate Change (IPCC) Fifth Assessment Report, which correspond to a lower emission and business-as-usual scenarios.
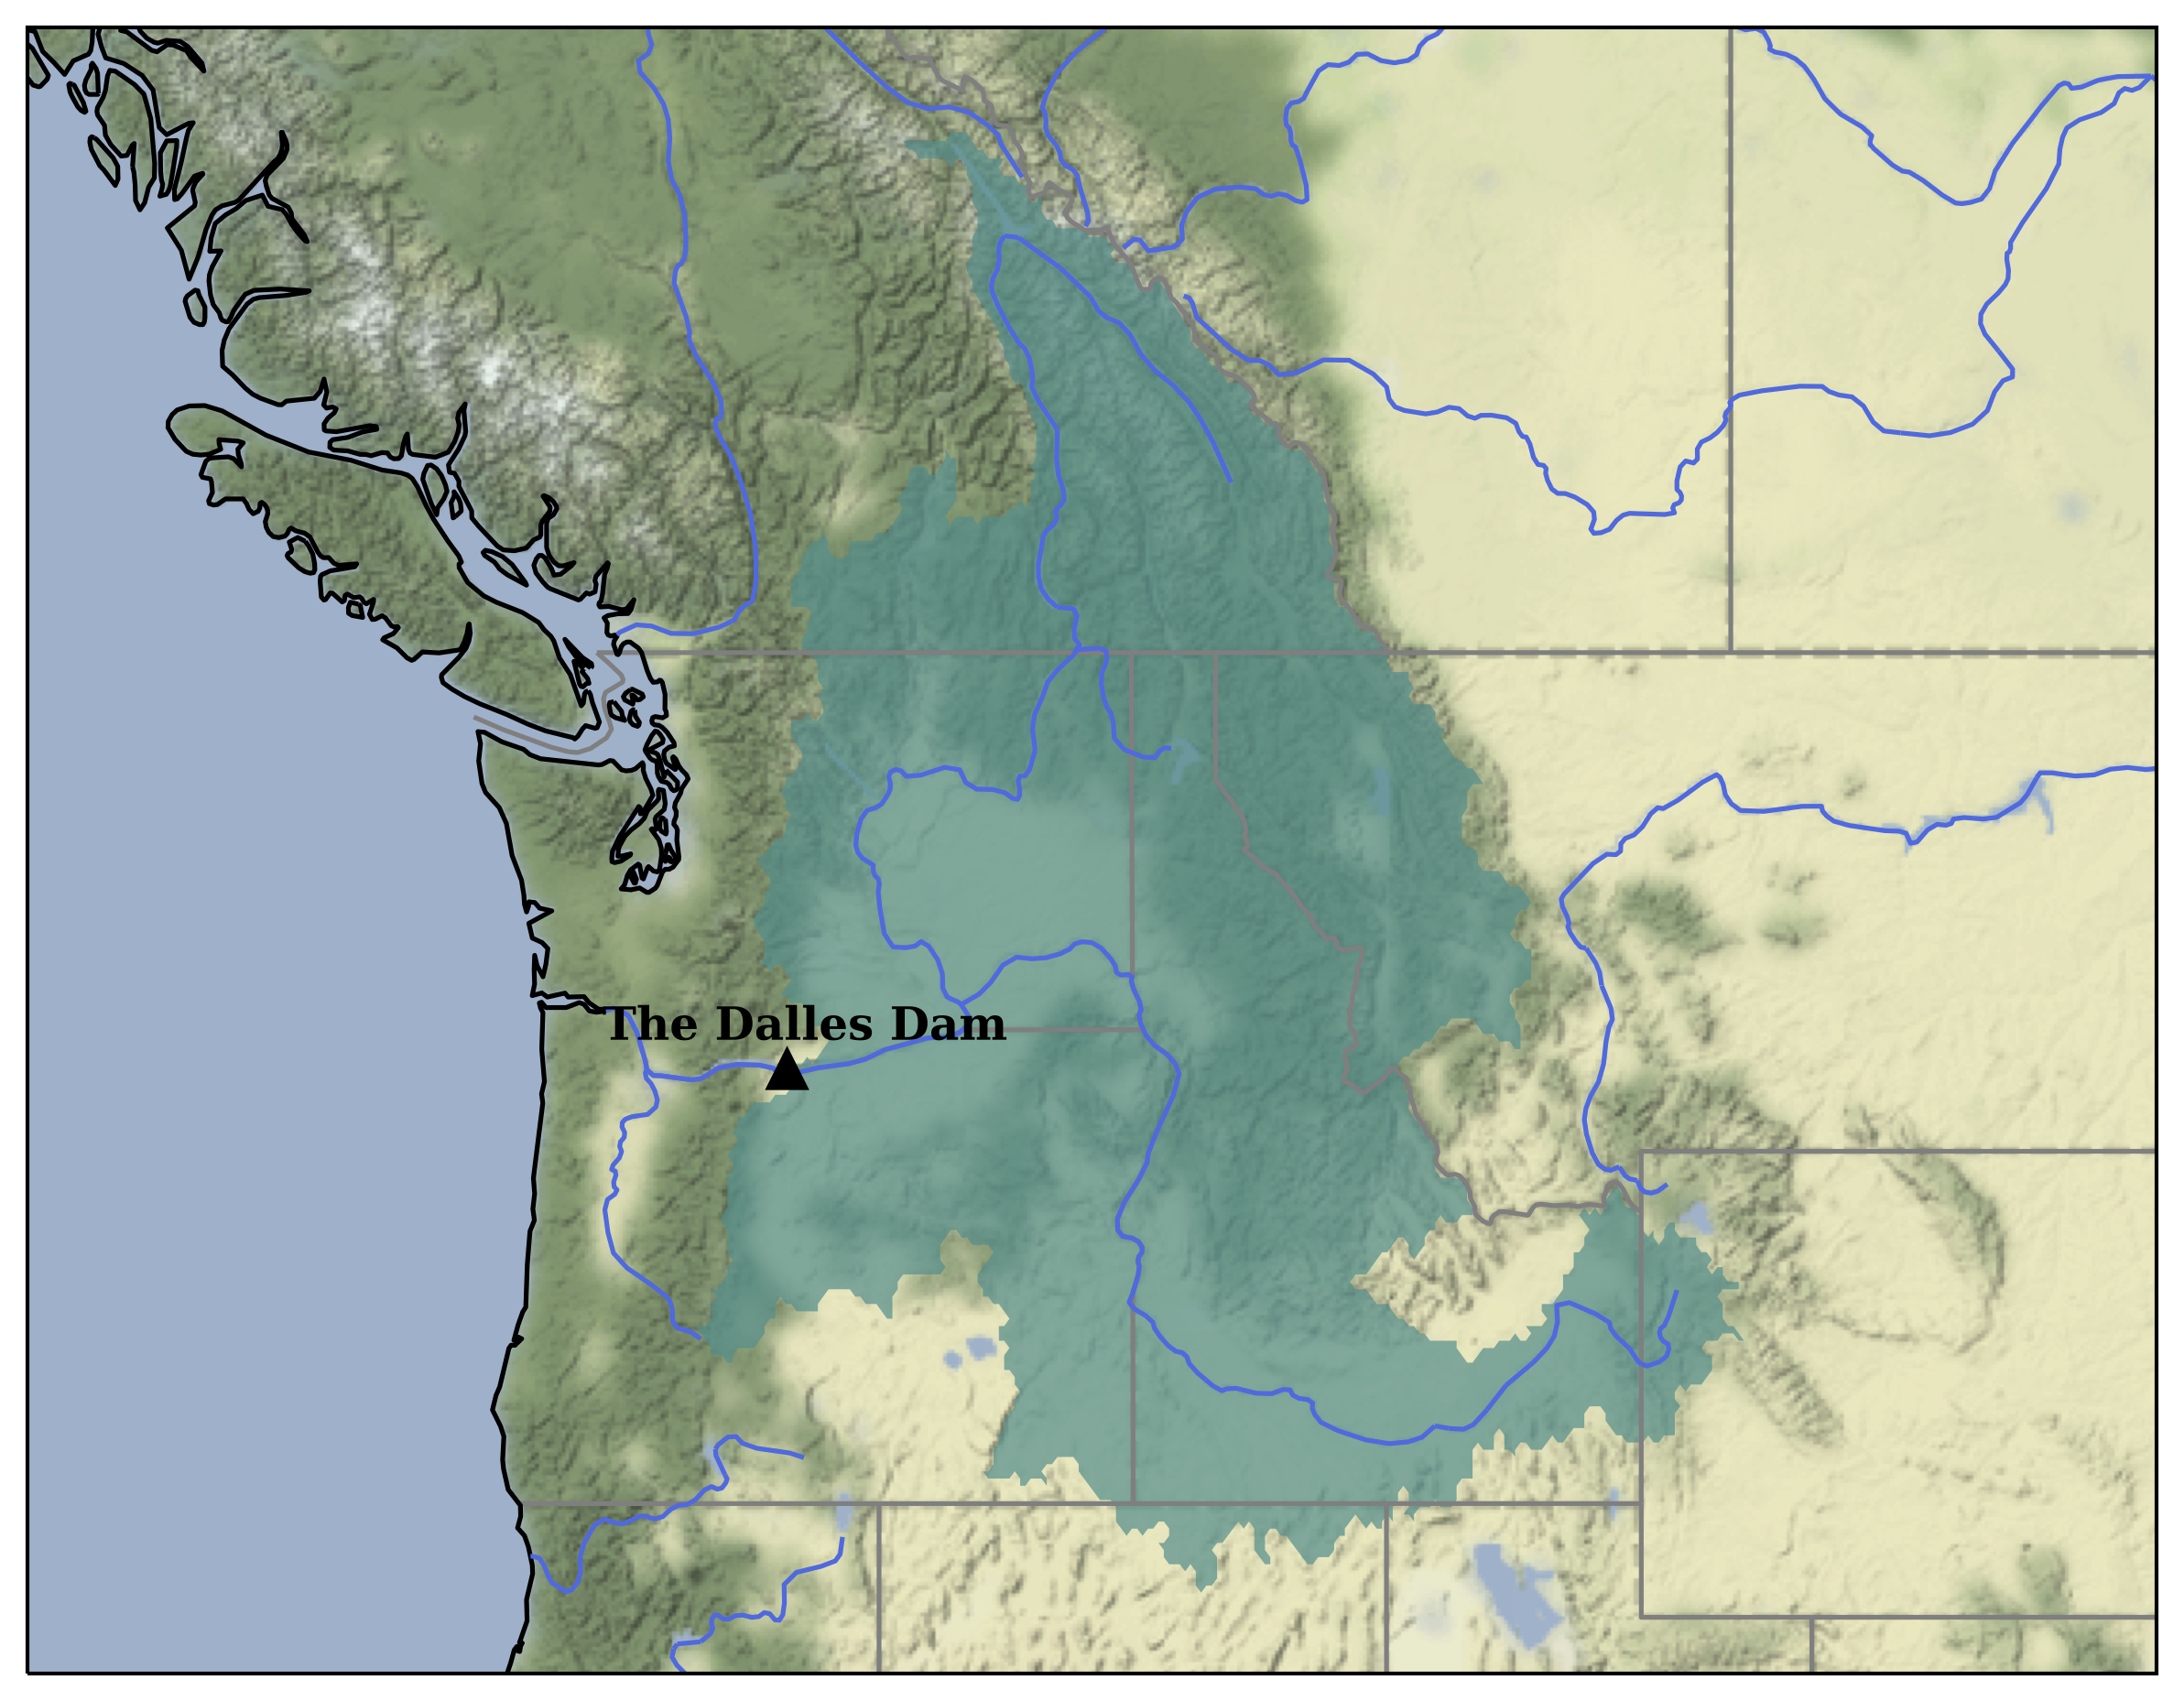
In this post we’ll examine the waterflow of the Columbia River at The Dalles Dam. This will give us insight into the largest river in the Pacific Northwest, with an upstream catchment that covers much of the region. Localized areas within the region will have their own unique streamflow characteristics, since runoff is influenced by numerous factors such as catchment size, climatic conditions, and vegetation cover. We’ll consider ten projections from the dataset, corresponding to one hydrological model forced by ten different climate models. We’ll define three periods of interest: Historical, which covers the years 1950-1980; Present, which covers the years 2000-2030; and Future, which covers the years 2070-2100. We’ll consider the RCP 8.5 scenario in this post, as it reflects our current pathway.
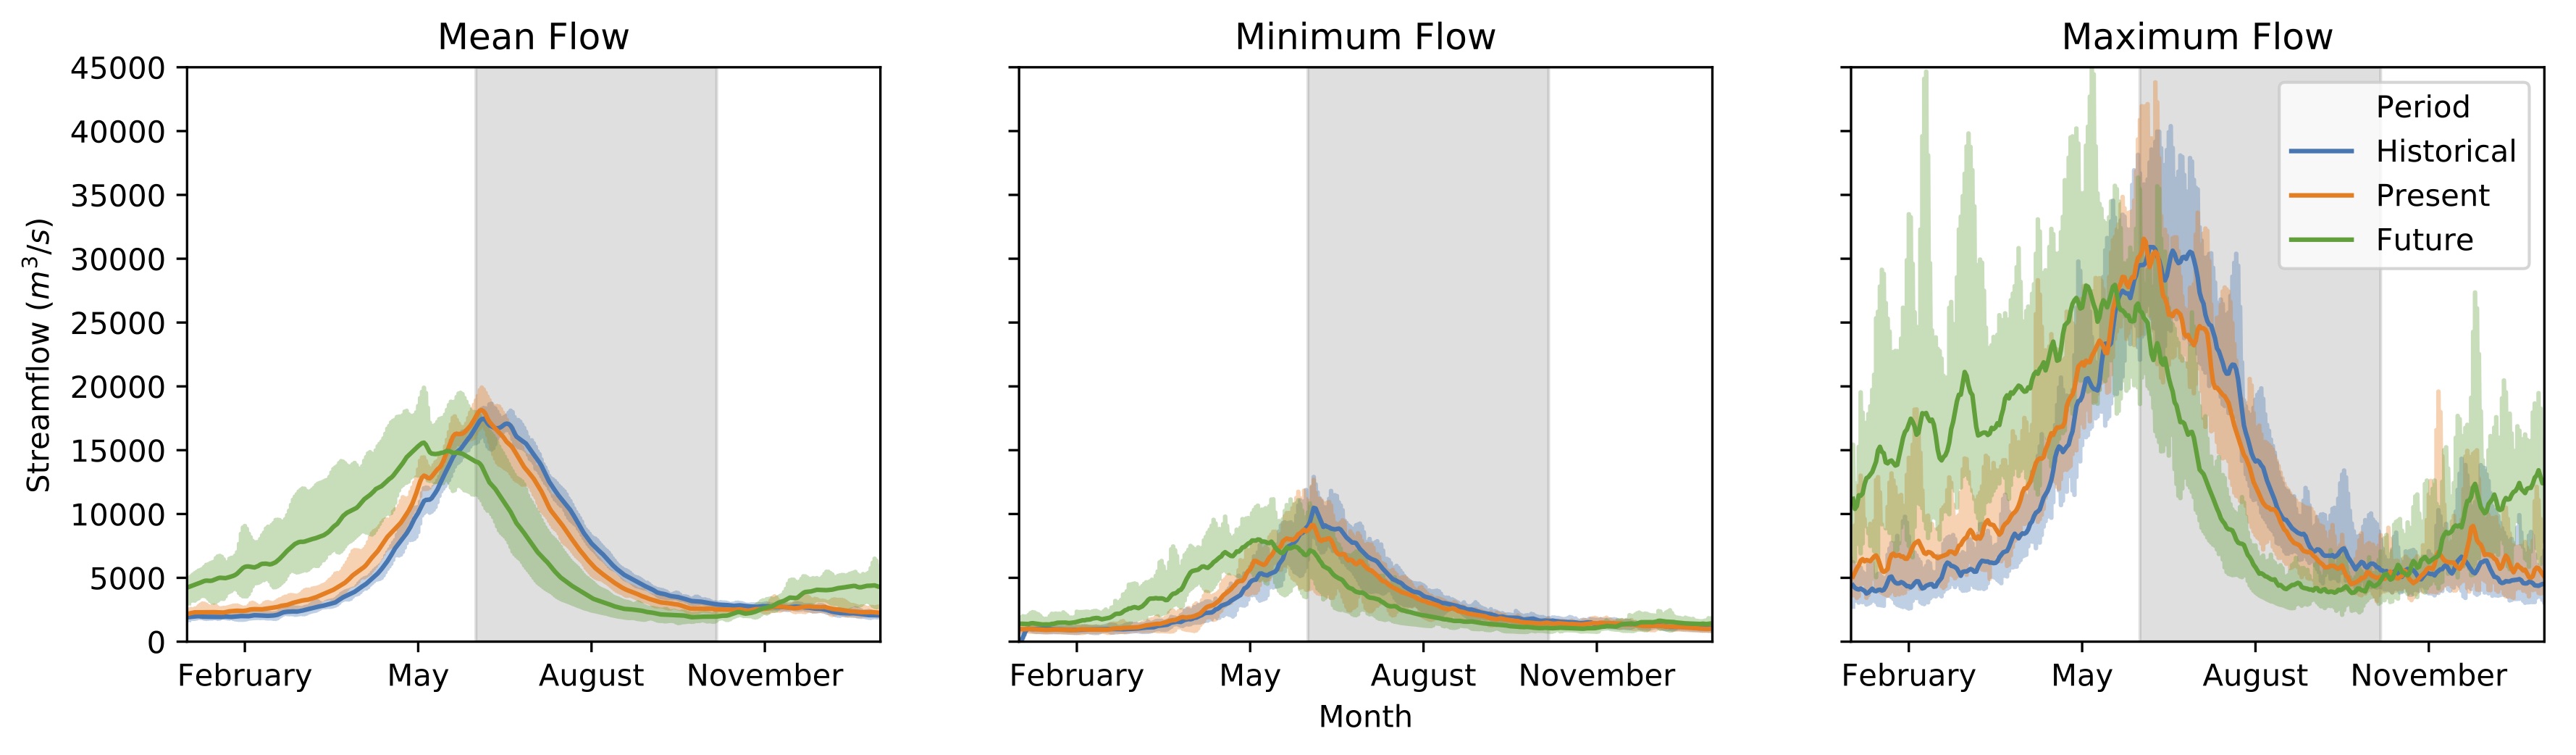
By the end of the 21st century, projections predict a pronounced shift towards higher streamflows in the winters and lower streamflows during the summers. A significant portion of the snow in the Pacific Northwest is in areas just under the freezing point. Warmer temperatures will increase the amount of winter precipitation that falls as rain rather than snow, and melt the snowpack earlier. This leads to higher runoff flowing into rivers during the winter, and a lower snowpack to feed streamflow during the summer. Annually, the mean streamflow of the Columbia is projected to increase moderately (~10%). While the Pacific Northwest has a perception of being perpetually wet, this is only true for half the year.
Warmer temperatures in the future will mean that the spring snowmelt event (freshet) will likely occur earlier and have a reduced peak runoff. The time of year when half of the annual runoff volume will pass the location of The Dalles Dam can be expected to shift earlier in the year. This will require new water managements strategies and increases to infrastructure to ensure that water resources are available year round, particularly in the late summer.
Summer streamflows are projected to be lower in the future, putting increased pressure on water resources. Household water consumption rises with temperature. Many cities have already put efforts into water conservation, as well as experienced water restrictions. However, households not only consume water directly through the tap, but also indirectly through food (as well as textiles, raw materials, and energy). Water is a critical resource for the agricultural sector. Sufficient water also plays an essential role in the health of our environment. Salmon, one of the iconic species of the Pacific Northwest, depend on adequate water to reach spawning grounds. Lower streamflows can reduce habitat capacity, and changes in water temperature may negatively impact fish species.
Higher winter flows are projected in the future. We see that mean flows will be approximately twice as high, with significant maximum flows. Projections suggest that future maximum winter flows may be higher than present spring freshets. However, it’s important to note that key processes in these projections such as rain-on-snow events are currently poorly constrained. Higher winter flows are of concern because they may increase flooding, and waterlogging of fields, if our infrastructure does not have sufficient capacity to evacuate water. The shift to higher streamflows in winter will additionally result in changing patterns of sediment and nutrient delivery to the coastal environment. However, there may be some positive benefits from the increased winter streamflows for hydro-electric energy producers.
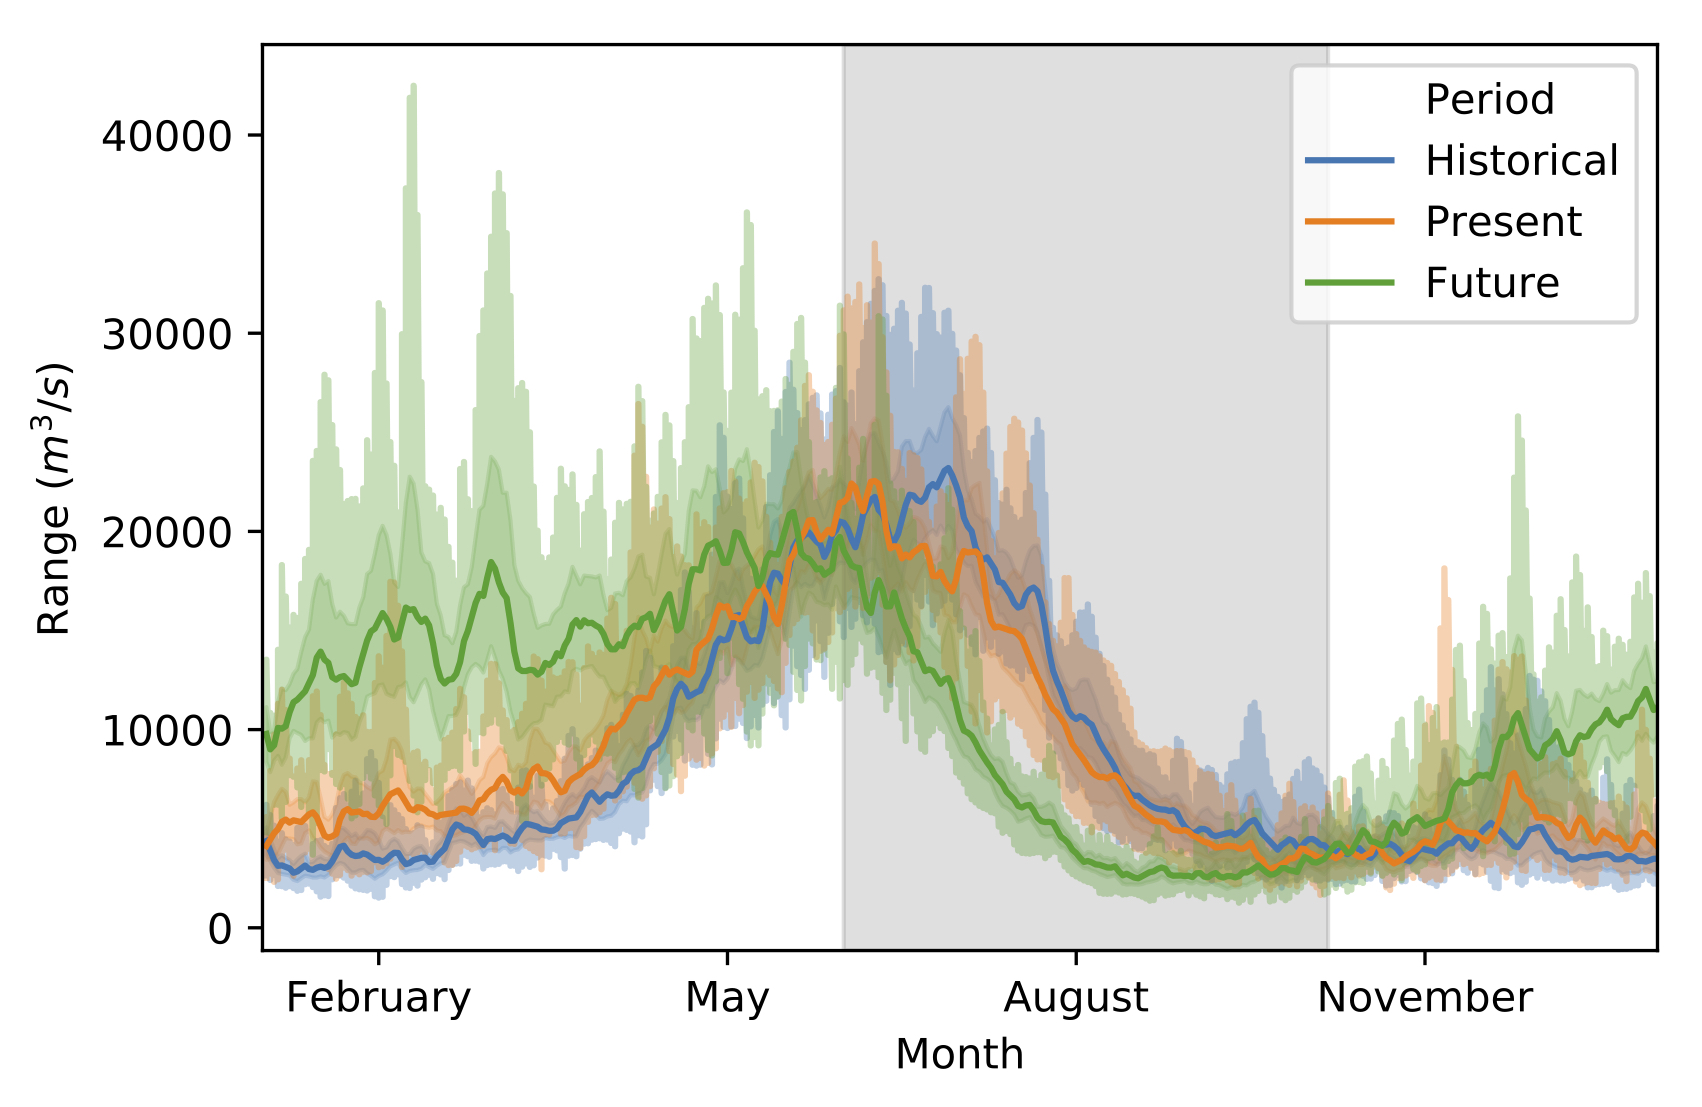
By taking the difference of projected maximum and minimum flows, we can examine how variable streamflow will be. Significant increases in variability are projected for winter streamflows. That is, winter streamflow will oscillate between disparate maximum and minumum levels, rather than maintaining a steady throughput. More variable flows increases the challenge of managing resorvoirs, which have to balance storing water, maintaining downstream flow, and preventing flooding. Increased water variability may also impact the timing and amount of electricity generated by run-of-the-river hydroelectric dams, with consequences for our electrical grid. Predicting near-future streamflow during winter will be an important task.
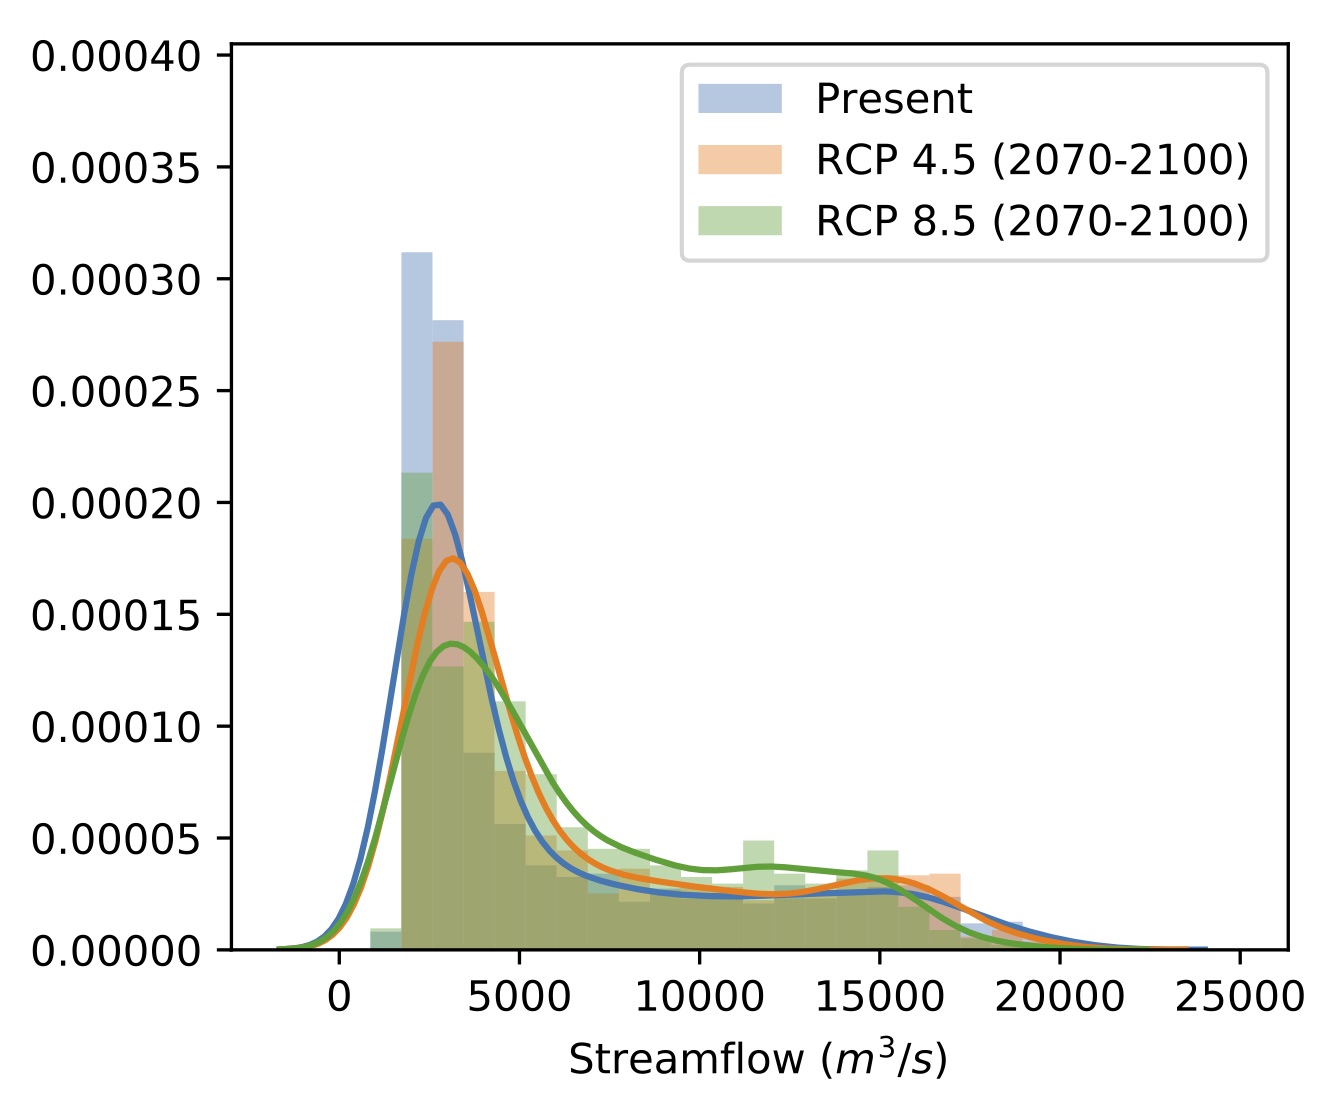
The RCP scenarios reflect different greenhouse gas emissions pathways. RCP 8.5 reflects a business-as-usual scenario, and is predicted to lead to 3.7 °C of global warming by the end of the century. RCP 4.5 scenario reflects a lower emission scenario limiting the expected global mean increase in temperature to 1.8 °C. Contrasting the present to the future under these two scenarios, we are already committed to seeing the hydrology of the Pacific Northwest change. The question that remains is how much? The answer has significant economic and cultural implications for the region.
Conclusion:
The Pacific Northwest depends on its water resources. As the hydrology of the region changes in response to global warming, the impacts will be felt by communities and water rights holders across the region. Climate models give us insight into the changes that will occur. In the post we’ve analyzed a dataset of projected streamflows at The Dalles Dam and found we should expect higher winter flows and lower summer flows in the future. Local regions with different terrain and climatic conditions will have responses that are more specific to the area. Analysis such as in this post help inform planning future infrastructure and management strategies.
If you’re interested in learning more about how climate change will impact the hydrology of the Pacific Northwest, check out these resources:
Pacific Climate Impacts Consortium: A regional climate service centre at the University of Victoria providing practical knowledge and tools for long-term climate planning for the Pacific and Yukon regions of Canada.
-
The Northwest Climate Toolbox: A collection of web tools for visualizing past and projected climate and hydrology of the Pacific Northwest, USA.
-
Hydroshare: An online system operated by the research organization CUAHSI enabling users to share and publish data and models designed for water-resources professionals, researchers, and educators.
The analysis in this post is meant to be fully reproducible. Jupyter Notebooks with the code to produce the figures used, as well as instructions on downloading the data are available on github.
Finally, the majority of this work was done at the University of Washington’s 2019 WaterHackweek, a week long collaborative data science and hydrology workshop. This work benefited greatly from the input and discussions with everyone involved.
Citations:
[1]: Chegwidden, O., B. Nijssen, D. Rupp, J.Arnold, M. Clark, J. Hamman, S.-C. Kao, Y. Mao, P. Mote, M. Pan, E. Pytlak, and M. Xiao, 2019: How do modeling decisions affect the spread among hydrologic climate change projections?. Earth’s Future, in revision.
[2]: Chegwidden, O. S., Nijssen, B., Rupp, D. E., & Mote, P. W. (2017). Hydrologic Response of the Columbia River System to Climate Change [Data set]. Zenodo. http://doi.org/10.5281/zenodo.854763